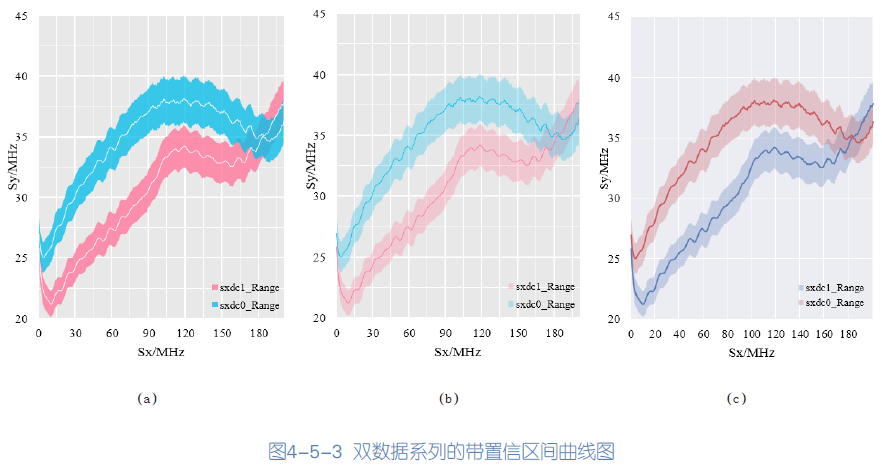
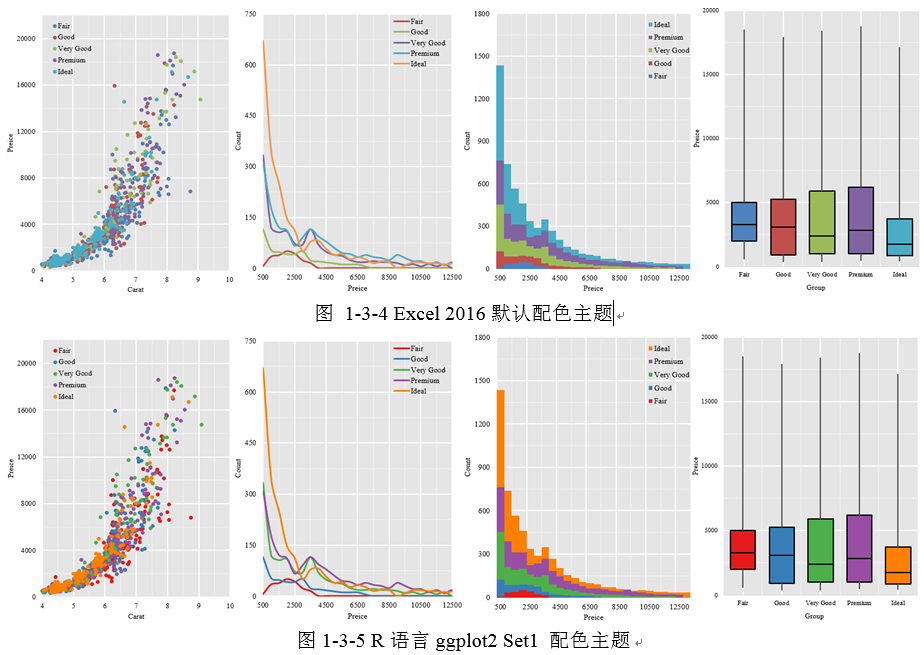
灰底无边框带置信区间折线图

import matplotlib.pyplot as plt
import numpy as np
import random

# 模拟数据
x = list(range(10))
y = [random.randint(0,10) for i in range(len(x))]
y2 = [random.randint(0,10) for i in range(len(x))]

y_upper = y + np.array([random.random() for i in range(len(x))])
y_lower = y - np.array([random.random() for i in range(len(x))])
y_upper2 = y2 + np.array([random.random() for i in range(len(x))])
y_lower2 = y2 - np.array([random.random() for i in range(len(x))])


# 绘制折线图
plt.plot(x, y,color='white')
plt.plot(x, y2,color='white')
plt.fill_between(x, y_lower, y_upper, color="#38C7E8", alpha=1)
plt.fill_between(x, y_lower2, y_upper2, color="#fb8eaa", alpha=1)

# 设置网格线的样式
plt.grid(color='white', linestyle='-', linewidth=1,  alpha=0.9)

# 设置网格的背景色
plt.gca().set_facecolor('#e8e8e8')  # 灰色底色
plt.gca().spines['top'].set_visible(False)
plt.gca().spines['right'].set_visible(False)
plt.gca().spines['bottom'].set_visible(False)
plt.gca().spines['left'].set_visible(False)

# 显示图形
plt.show()
import matplotlib.pyplot as plt
import numpy as np
import random

# 模拟数据
x = list(range(10))
y = [random.randint(0,5) for i in range(len(x))]
y2 = [random.randint(0,5) for i in range(len(x))]

y_upper = y + np.array([random.random() for i in range(len(x))])
y_lower = y - np.array([random.random() for i in range(len(x))])
y_upper2 = y2 + np.array([random.random() for i in range(len(x))])
y_lower2 = y2 - np.array([random.random() for i in range(len(x))])


# 绘制折线图
plt.plot(x, y,color='#cd676b')
plt.plot(x, y2,color='#5a7fb8')
plt.fill_between(x, y_lower, y_upper, color="#e3c3c9", alpha=1)
plt.fill_between(x, y_lower2, y_upper2, color="#c1cbe1", alpha=1)

# 设置网格线的样式
plt.grid(color='white', linestyle='-', linewidth=1,  alpha=0.9)

# 设置网格的背景色
plt.gca().set_facecolor('#ececf3')
plt.gca().spines['top'].set_visible(False)
plt.gca().spines['right'].set_visible(False)
plt.gca().spines['bottom'].set_visible(False)
plt.gca().spines['left'].set_visible(False)

# 显示图形
plt.show()
其他的


